Up Rogues Gallery Prev Next Slideshow

 At first page  Next image  Index page


  CO plot 1.jpg -  The CO baseline between April to June looks high.July to September clearly shows a saw tooth profile caused by drifting zeros.This will affect the CO annual mean. The CO baseline can be quickly stabilised using appropriate zeros.  
CO plot 2
NO2 plot1
NO2 plot 2
NO2 plot 3
NO2 plot 4

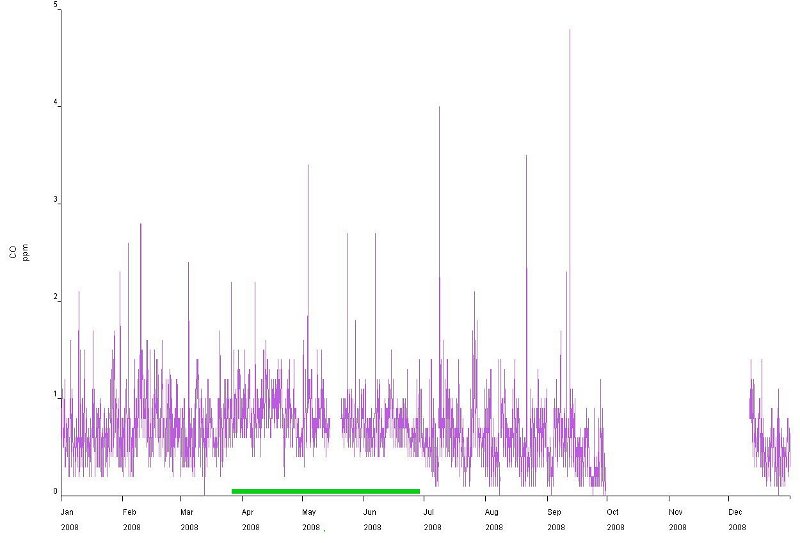
The CO baseline between April to June looks high.
July to September clearly shows a saw tooth profile caused by drifting zeros.
This will affect the CO annual mean. The CO baseline can be quickly stabilised using appropriate zeros.
Download
Total images: 50 | Help